placeholder

How building a glucose monitoring app revealed the power of AI decision-making

From data to doughnuts: Using AI to prevent blood sugar emergencies while cycling.

MAR. 6, 2025
3 Min Read
by
Donovan Crewe

How it started

I recently read about a cyclist who always missed out on doughnuts at café stops because he was a bit slower than the rest of the group. His solution? He built a simple app that checked his location and ordered doughnuts when he was 20 minutes away. I wanted to take that idea further.
A few years ago, I was diagnosed with Type 1 Diabetes. My body no longer produces insulin, requiring artificial supplementation through injections. The constant insulin-after-eating roller coaster drove me crazy, leading me to discover cycling to burn excess glucose while enjoying occasional sweet treats during rides.
As an avid cyclist, I’ve found myself 60 miles into a 100-mile gravel ride before realizing I was down to my last snack. With my blood sugar dropping at an alarming rate, I’d be stuck in the middle of nowhere—on a fire road, resembling something from the Texas Chainsaw Massacre. It was time to build a solution.

The project goal

Blood sugar is complex, and influenced by countless factors. That's why I wear a Continuous Glucose Monitor (CGM) that streams data to my Garmin. I typically burn through 20g of carbs every 20-30 minutes of cycling but often eat too little, too late, resulting in a weird game of catch-up.
So I created a service that predicts when my blood sugar will drop and finds a store within range based on my speed and route, provides directions, and orders something that will be ready when I arrive.

The building blocks: Integrating standard code and AI

By applying a smart architecture, I can leverage existing technologies while focusing AI development where it truly adds value.
Here’s the component breakdown:
  • Get Garmin live data to an API: Garmin’s LiveTrack feature already provides accessible real-time riding data through their standard endpoints.
  • Predict a blood sugar drop based on Garmin data: This is where machine learning shines–I’ll evaluate several predictive models trained on my historical ride data to find the optimal approach.
  • Find a nearby restaurant and order something: Third-party APIs from Google, Uber, and others handle the logistics, while an LLM can personalize food selection based on my specific nutritional needs.
Based on the list above, the only AI-driven components needed are blood sugar prediction and food selection. Most of the rest can be handled through standard tasks.

Data, data, data

Accurately predicting blood sugar drops during rides is essential. For this, I followed CRISP-DM (Cross Industry Standard Process for Data Mining). As William Vorhies notes, this framework “provides strong guidance for even the most advanced of today's data science activities.”
CRISP-DM breaks down into six key phases:
  • Business understanding: Define project goals from a business perspective, understand the problem, and define project objectives.
  • Data understanding: Collect initial data and explore it to identify patterns, quality issues, and the structure to guide further steps.
  • Data preparation: Clean and transform data, selecting and organizing it into a usable form for modeling.
  • Modeling: Use various modeling techniques to create predictive or descriptive models.
  • Evaluation: Assess model quality and performance against project objectives to ensure it meets business needs.
  • Deployment: Implement the model in a real environment, sharing results and setting up systems for ongoing use.

My data sources

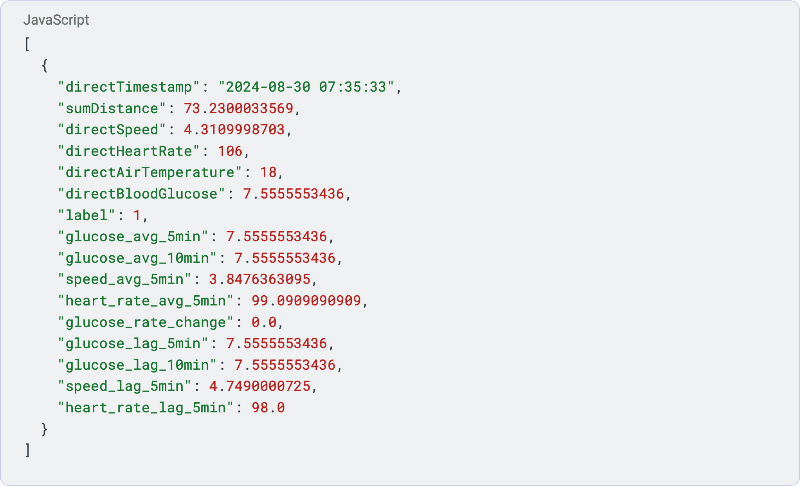
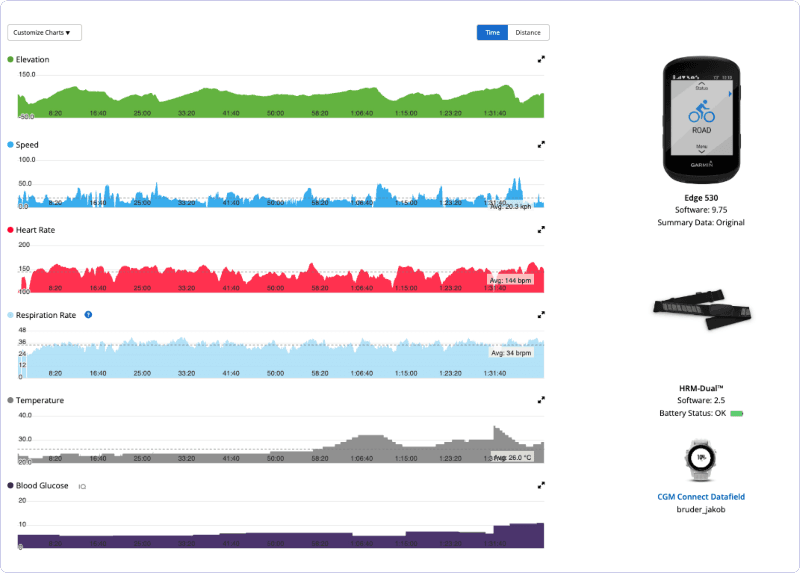
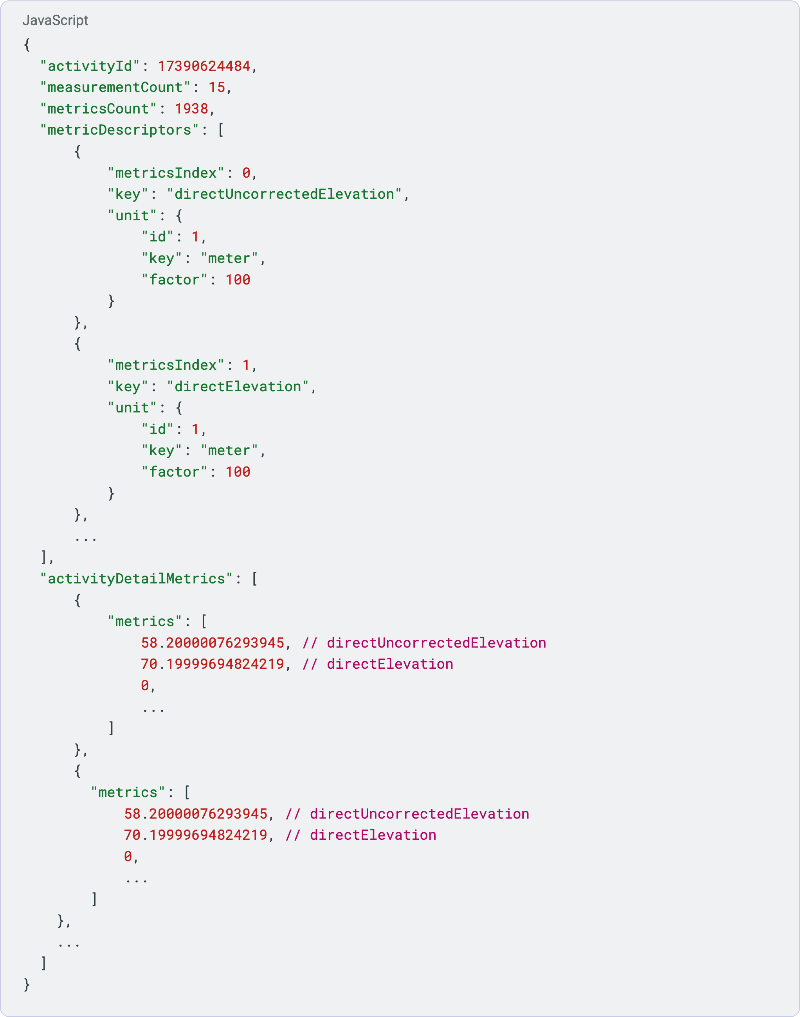
I’m a gadget person. I use a CGM, heart rate monitor, and Edge cycling computer that all feed into Garmin Connect. While Connect doesn’t have a “download all” button for ride data, its web interface displays everything I need in one place. With some web scraping magic, I can pull comprehensive datasets that show trends throughout my rides, capturing the metrics displayed in those helpful graphs.
The data I extracted comes in an unusual format, likely designed for efficiency. It consists of an array of descriptors that indicate which value at each index corresponds to a specific attribute. For example:

To start, I pulled a few ‘rides’ as I wanted to hone the next steps: cleaning, engineering, and labeling before dumping a massive amount of data at them.

Data cleaning, feature engineering, and labeling

If you’ve ever delved into data science, you know that collecting raw data is just the first step. 
Raw data from devices isn’t perfect. Whether it’s spotty signals on a ride or device quirks, things can get messy and lead to inaccurate results. Here’s how I clean my data:
  • Read and combine data: Pull JSON files from a directory containing ride data, parse each file, and map its metrics dynamically based on descriptors to create a DataFrame.
  • Timestamp parsing and sorting: Convert timestamps to a datetime format and sort them to ensure chronological order.
  • Feature selection: Choose relevant columns such as distance, speed, heart rate, air temperature, and blood sugar from Garmin for analysis, omitting unnecessary ones.
  • Handle missing values: Use forward-filling (ffill()) to fill any gaps, ensuring I don’t encounter sudden data drop-offs mid-prediction.
This process creates a much cleaner and more uniform dataset to work with:
Now I’ll prepare the data to make meaningful predictions. Good feature engineering transforms raw measurements into patterns a model can learn from.
Here are the key features:
  • Target label: I’m defining a 20-30 minute prediction window with a hypoglycemia threshold (70 mg/dL). This gives the model a clear event to predict.
  • Rolling averages: Smoothing glucose, speed, and heart rate data will reveal underlying trends rather than momentary spikes.
  • Rate of change: Tracking how quickly glucose levels rise or fall helps identify concerning patterns before they become problems.
  • Lag features: Including past values gives the model historical context, essential since the body's response to exercise isn't instantaneous.
After calculating these features, I’ll clean the dataset once more to remove any missing values from rolling calculations, ensuring the model trains on complete information.
Challenges this addresses:
  • Aligns data with actual physiological responses
  • Maintains data quality despite real-world collection limitations
  • Creates rich features that capture meaningful trends
With this prepared dataset, I’m ready to train a model that should alert me before I need that emergency snack. Here's what the final data looks like:

Modeling

Selecting an unsuitable model can hinder progress. To simplify the process, I start by asking key questions about the dataset and task requirements. (Thankfully, many of these questions may already have been addressed during the data understanding phase.)
1. What are the key characteristics of the data?
  • Are the features continuous, categorical, or a mix?
  • Is the task to predict a label (classification) or a continuous value (regression)?
  • Does the data have potential noise or variability (e.g., physiological data like glucose or heart rate)?
Key observations:
  • The dataset contains a mix of continuous features (e.g., sumDistance, directSpeed) and possibly a categorical target variable (label).
  • Physiological measurements like glucose and heart rate may have variability or noise.
2. What potential challenges exist with the dataset?
  • Is the dataset at risk of overfitting due to small size or high variability?
  • Are there outliers or noisy features?
  • Could the relationships between features and the target be non-linear?
Key observations:
  • Features such as heart_rate_avg_5min and glucose_avg_5min may exhibit non-linear relationships with the target.
  • Variability in physiological measurements introduces noise that the model needs to handle.
3. What capabilities should the model have?
  • Should it handle non-linear relationships effectively?
  • Does it need to be robust to overfitting?
  • Can it accommodate mixed data types and outliers without extensive preprocessing?
Key observations:
  • The dataset likely involves non-linear relationships and noisy features.
  • Minimal preprocessing is preferred, given the variability in features like directSpeed and glucose_rate_change.
4. What types of models align with the dataset and task requirements?
  • Linear models: Efficient but may fail to capture non-linear relationships.
  • Tree-based models: Handle non-linearity, noise, and mixed data types effectively.
  • Neural networks: Highly powerful but require large datasets and substantial tuning.
Key observation:
  • Tree-based models, such as Random Forests, are well-suited to this dataset due to their ability to handle non-linearity, noise, and mixed feature types.
This structured approach ensures a clear and logical path to selecting the most suitable model, aligning with the dataset’s characteristics and requirements and in this case, Random Forest seems to be the best match.

Training

With a clean, feature-rich dataset, it’s time to train a model that can predict when my blood sugar is about to nosedive. This is the exciting part—where I move from data wrangling to building  something useful. But, as with all things machine learning, it’s not just about throwing data into a model and hoping for the best. I need to be strategic.

Setting up the training pipeline

To start, I’ll split my dataset into three groups. This ensures I don’t just build a model that memorizes past rides but instead, learns patterns that generalize to any ride:
  • Training set (70%): This is the bulk of the data the model will learn from.
  • Validation set (20%): Used to fine-tune hyperparameters and prevent overfitting.
  • Test set (10%): The final proving ground to see how well the model generalizes to unseen data.
Next, I normalize the features so that everything operates on a similar scale. While tree-based models such as Random Forest don’t require normalization, I want to compare it with gradient-boosted trees (i.e., XGBoost), and maybe a lightweight neural network later. Keeping preprocessing consistent now saves trouble down the line.

Choosing a baseline model

Before jumping into hyperparameter tuning, I always start with a baseline model. In this case, a simple logistic regression will do. If it performs decently, I'm onto something. If it fails miserably, I’ll need to re-evaluate features or data quality.
The baseline helps answer an important question: Is my problem predictable? If a dumb model beats chance (50/50 guessing), I’ll know the features contain useful signals. If not, I’ll need to go back and rethink feature engineering.

Training the random forest model

Since the data involves non-linear relationships and physiological variability, Random Forest is a solid starting point. It works well with tabular data, handles noisy inputs, and avoids overfitting better than deep learning models on small datasets.
The main hyperparameters I focus on are:
  • Number of trees (n_estimators): More trees generally mean better performance but longer training time.
  • Max depth: Controls how complex each tree can get; too deep and I risk overfitting.
  • Min samples per split: Prevents the model from overfitting by ensuring splits happen only when there’s enough data.
  • Feature importance: Identifies which metrics contribute most to predictions (e.g., is heart rate or glucose rate of change the biggest indicator?).
I use grid search with cross-validation to find the best combination of these. Essentially, I let the computer test different values and pick the most promising ones.

Evaluating performance

Once trained, it’s time to see how well the model performs. Since I'm predicting a drop in blood sugar, I care more about recall than precision—it’s better to have a few false alarms than to miss a real drop.
The key metrics I’ll be looking at are:
  • Accuracy: Overall correctness (but not always the best metric for imbalanced problems).
  • Precision & Recall: Precision tells me how many of my low-sugar warnings were actually correct, while recall tells me how many real drops the model caught.
  • F1-score: A balance of precision and recall that helps tune trade-offs.
  • ROC-AUC –: Measures how well the model distinguishes between stable and dropping blood sugar.

Testing in the real world

Early results show promise! But a model that shines in a Jupyter notebook isn’t the same as one that saves me from bonking mid-ride. Time for real-world testing.

Live testing on rides

I need a way to run my predictions during a ride, not after. My system must:
  1. Pull real-time data from my Garmin and CGM
  2. Run continuous predictions on rolling data windows
  3. Alert me when action is needed
I’m starting with a simple script running on a second device during rides, comparing predicted warnings against actual experiences. This exposes what datasets can’t—those pesky edge cases. Endurance rides differ from high-intensity intervals, and sometimes my body just has other plans. With more fine-tuning and data, I’ll soon connect these predictions to automatically locate and order from nearby food stops.

From personal project to business application

At first glance, this might seem like a niche personal project. But the principles behind it are applicable far beyond cycling or blood sugar prediction.

1. Real-time predictive analytics

The core idea here—ingesting real-time physiological data and making predictions—translates directly into health tech, wearable integrations, and IoT applications. Businesses in these spaces are already looking for ways to provide users with actionable insights, not just raw data.

2. AI for personalized recommendations

The model doesn’t just predict; it suggests when I need to take action to prevent a problem. This is the same type of personalized AI-driven decision support used in:
Fitness coaching apps–Optimizing workouts based on real-time performance.
Digital health monitoring–Predicting health risks before they happen.
Supply chain forecasting–Predicting stock shortages before they impact sales.

3. Compliance & ethical AI

Since this project deals with health data, privacy and compliance (GDPR, CCPA) are important even at a small scale. The same principles apply to any business handling user-generated health, financial, or operational data. Making sure predictions are explainable, non-biased, and privacy-conscious is a requirement, not an afterthought.

Final thoughts

This started as a personal project to prevent blood sugar crashes during long rides, but it represents a much bigger concept: using AI to turn raw data into real-world decisions. Whether applied to health, sports, or business, the key takeaways remain the same—clean data, strong models, real-world validation, and ethical AI practices.
Now, with a working prototype, the next step is making it truly real-time, accurate, and usable—because in cycling (and in business), knowing a problem is coming is only useful if you act in time to fix it.